Clint Van Marrewijk
February 1, 2026
Most people think that lithium is a rare mineral, and that the world is going to run out of it. But that’s incorrect.
There are dozens of high-quality lithium assets that are undeveloped.
Before we explain how to compare & rank the lithium assets that are already known to exist, let's first highlight one, as an example.
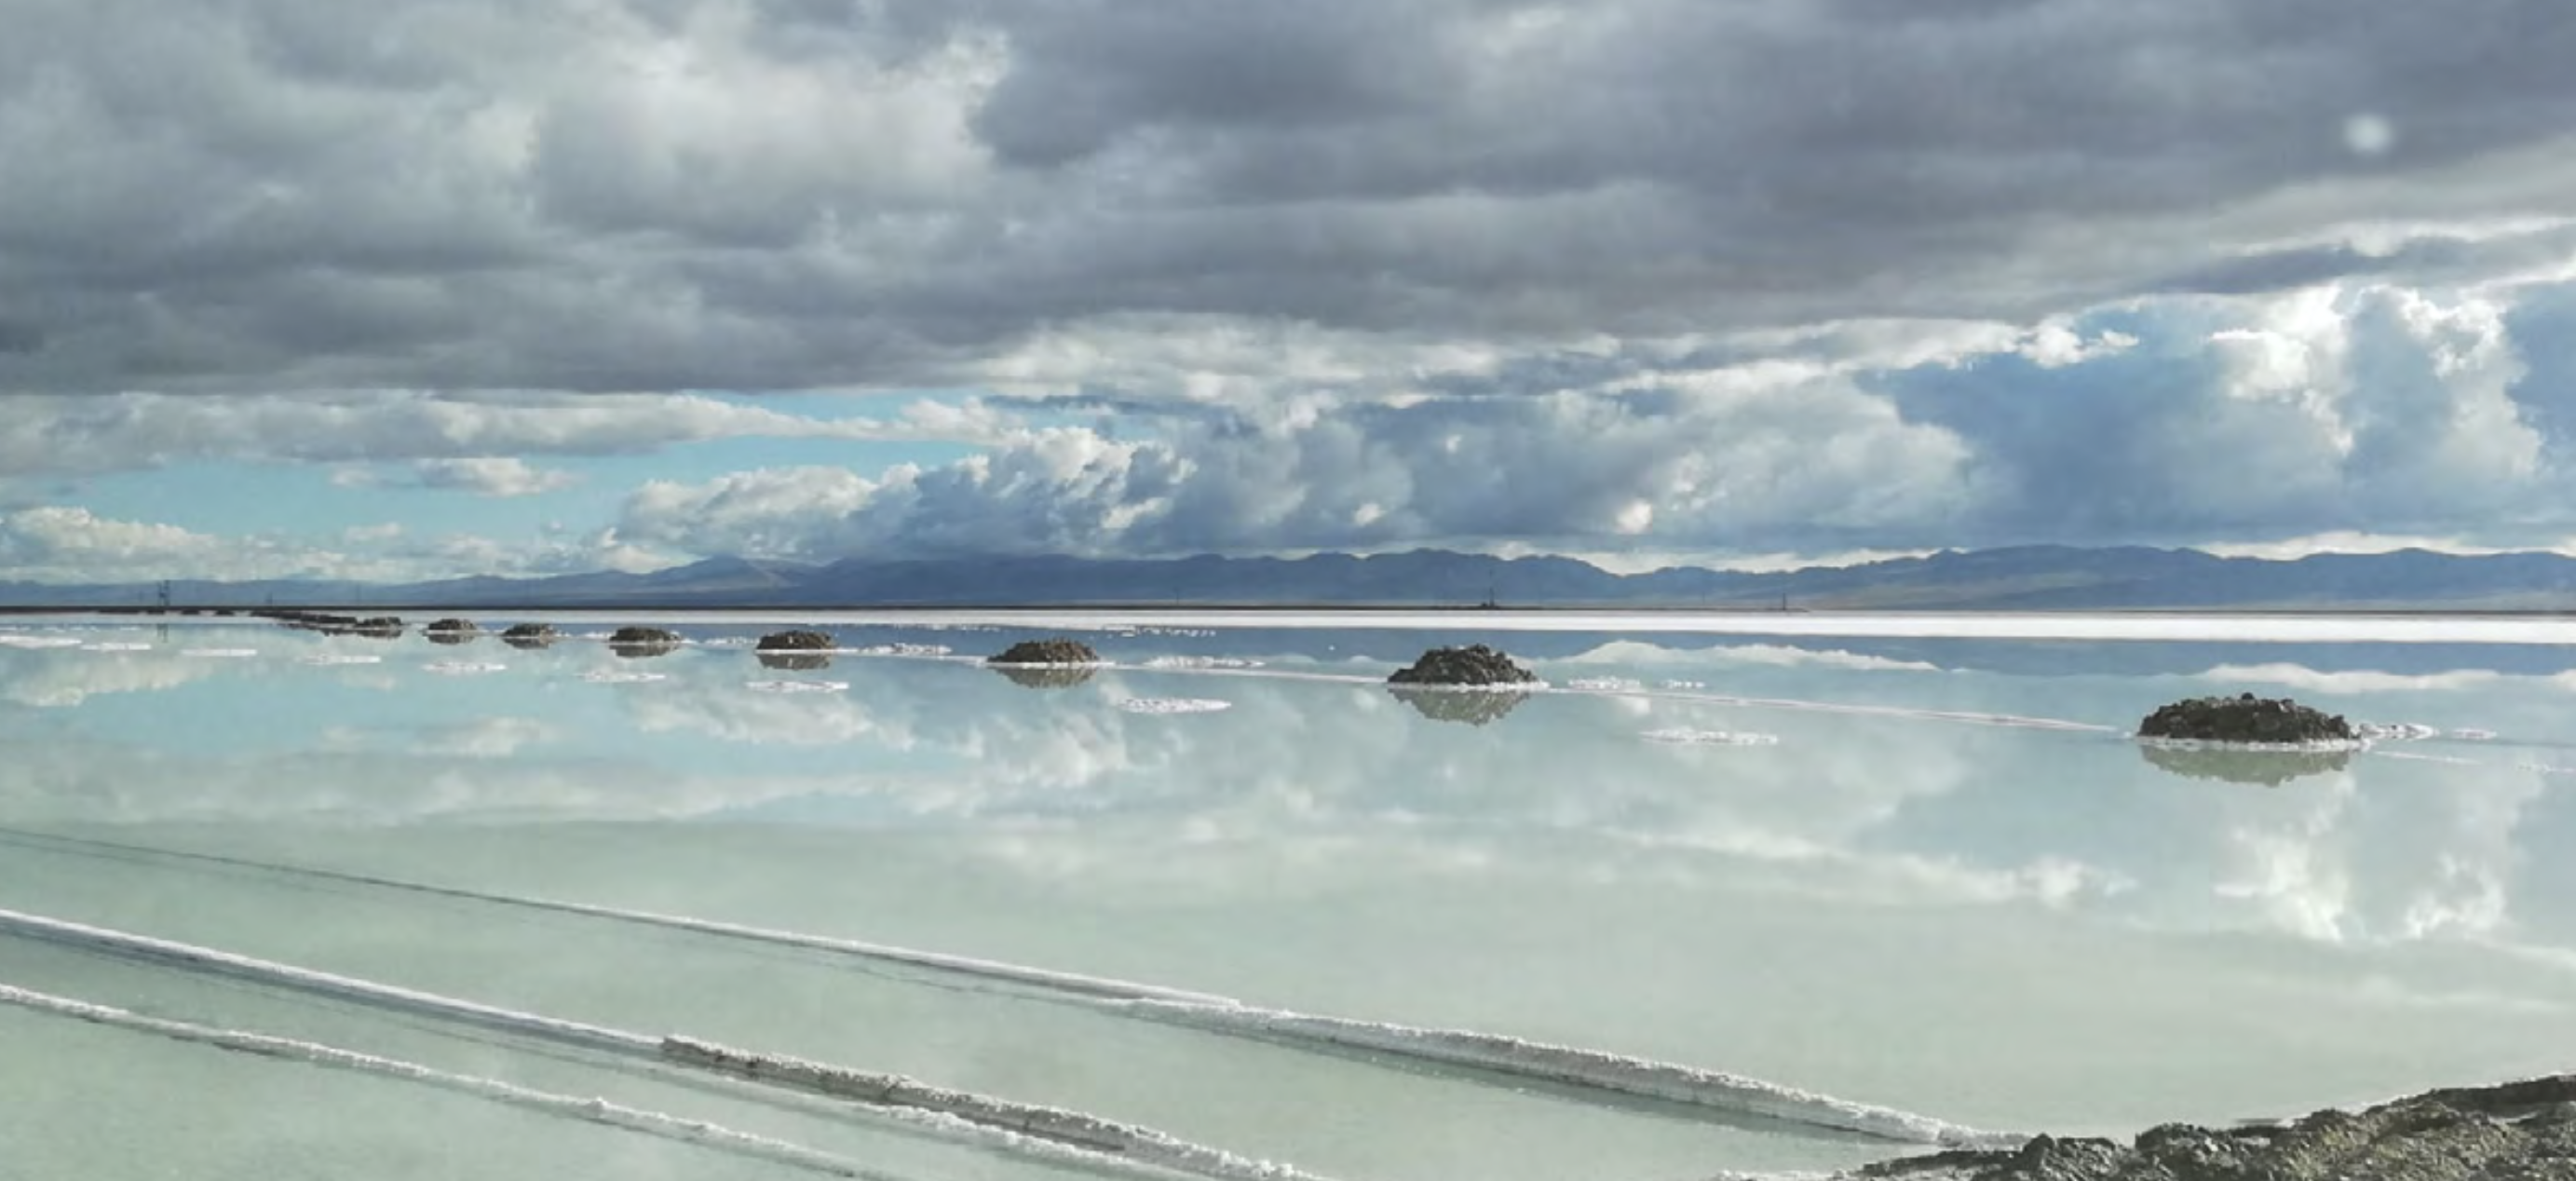
The lithium brine aquifer inside an undeveloped asset in Argentina
An Example Asset:
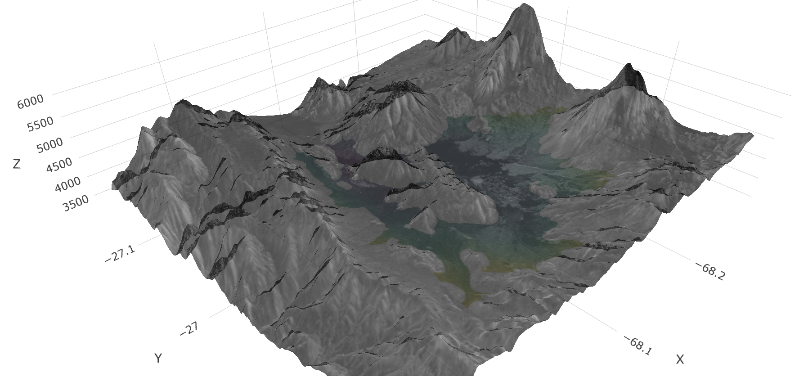
Located in the Catamarca province of Argentina, the San Jorge brine project (shown above) is owned by Greenwing Resources, an ASX-listed company. The basin has only 6 holes drilled in it, to a maximum depth of 400m. All holes intersect lithium brine, with the aquifer open at depth and to the West and North.
This project comprises a comprehensive land package of 15 leases covering some 38,000 hectares across the entire salar and surrounds, without neighbouring companies (this is a major positive).
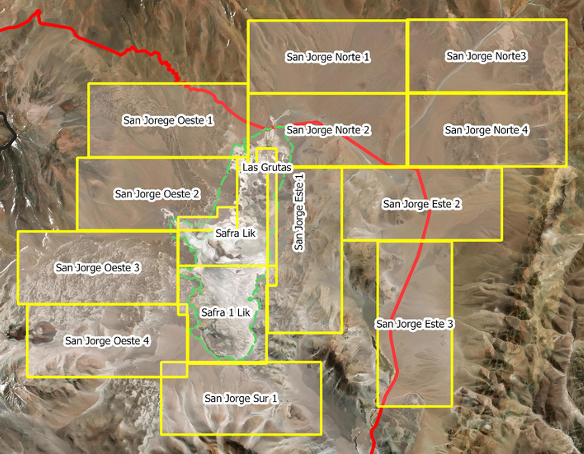
The project land package covering salar de San Francisco
Quality logging and subsurface interpretation has been completed, and there is 1.07M tonnes of Lithium Carbonate Equivalent (LCE) currently estimated, with clear potential to increase this.
- The asset’s resource size will increase with more drilling.
- There is potential for higher lithium grades at depth.
- Surface geophysics indicate the underground brine system extends beyond the areas drilled, stretching roughly 4kms to the West, and 5kms to the North towards the edge of the lease.
Simply put, this project deserves additional drilling and engineering to progress it to a completed PFS.
Explaining how to compare & rank lithium assets
There are three types of lithium brine projects: Oilfield brines, Geothermal brines, and Continental brines.
Inside these categories, Zelandez tracks 258 lithium brine projects that do not yet produce lithium.
When comparing these projects, we consider there to be 11 key attributes that matter. These attributes can be scored and ranked for each brine asset. Importantly too, they can be weighted according to the capability, risk profile, and needs of the owner.
![]()
Each key attribute above should be ranked relative to the best-in-class project that is known. To do this well an experienced team is needed, with deep knowledge of Oilfield, Geothermal and Continental Brines.
The purpose of all this information gathering (and considerable effort) is to filter the 250+ lithium brine projects for those with a high return on investment.
Let us explain this for you in more detail.
Comparing the economic return of each lithium project
Investors in lithium often come from sectors that don’t focus on mining, and they therefore don’t view lithium projects from a mining perspective.
To explain the valuation of lithium projects then, we will elaborate on two key concepts that are not always obvious.
The cost curve
For lithium insiders the concept of the “Cost Curve” is close to an obsession.
This is because insiders understand that over the life of a mine, the commodity’s price will fluctuate significantly.
Meaning that being a low cost operation (compared to others) is the key to profitability and survival.
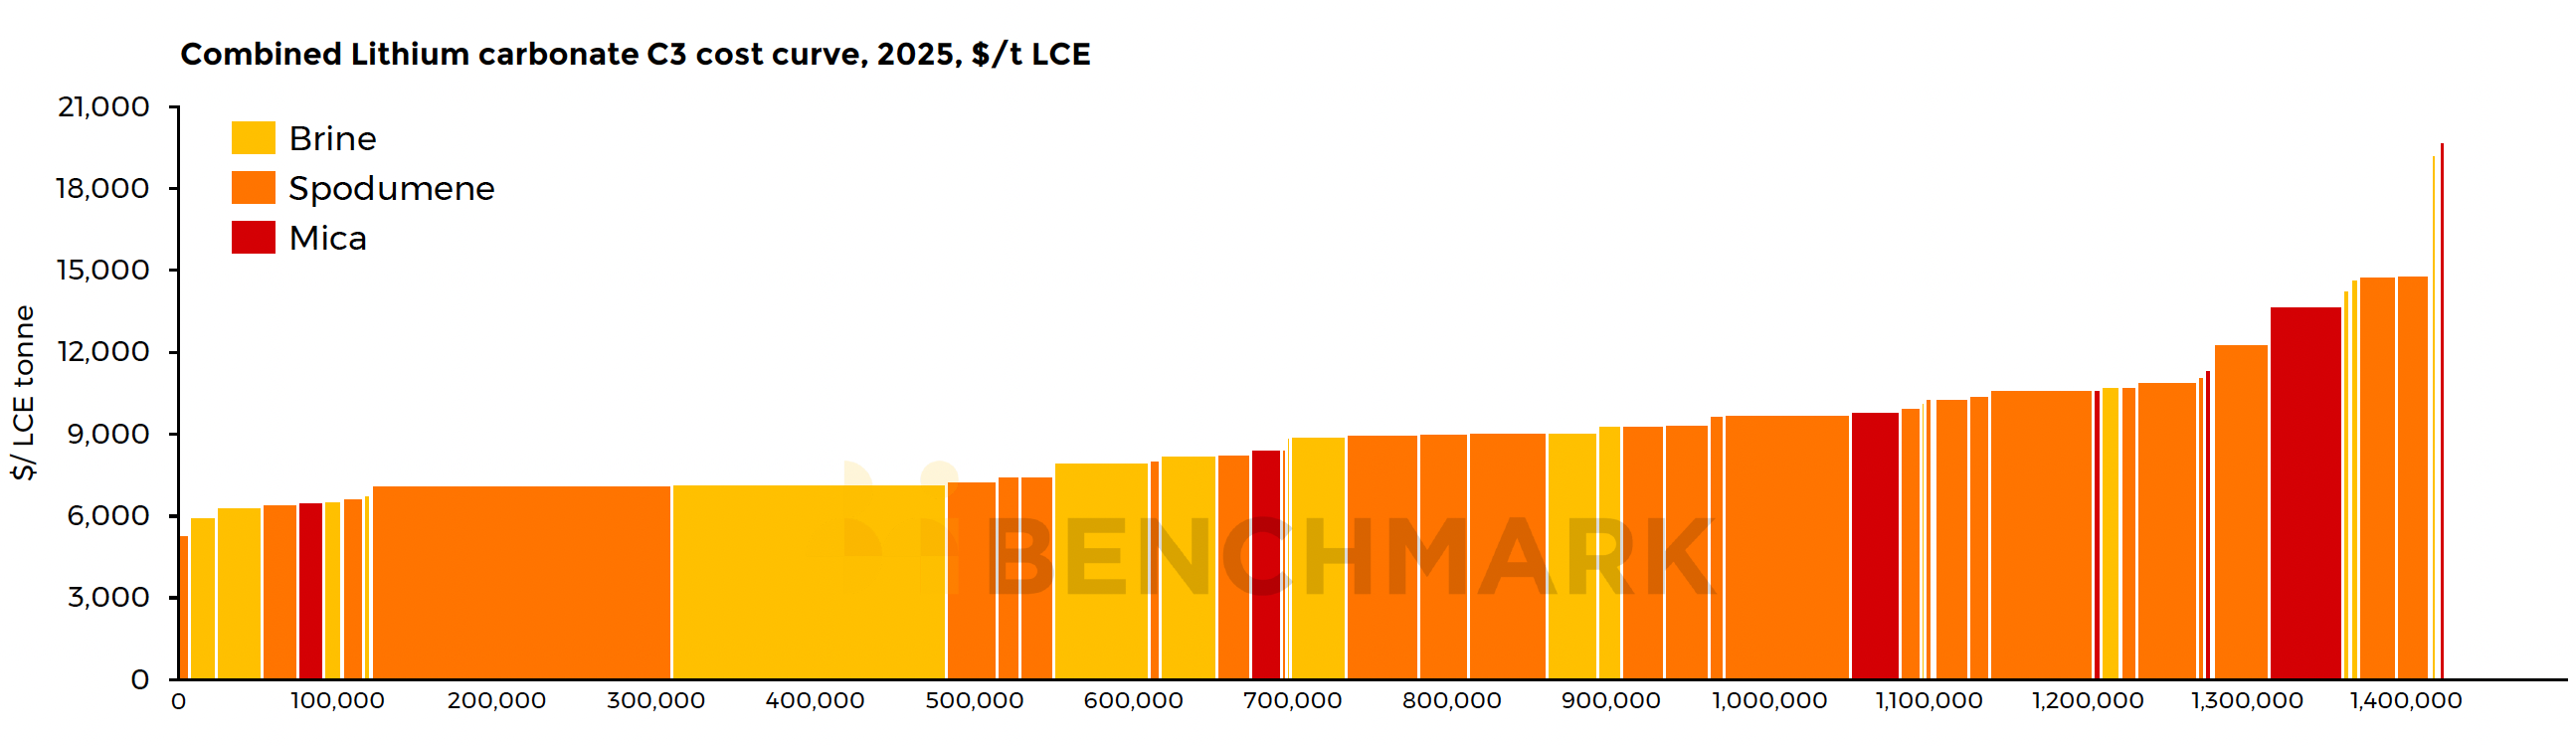
Cost Curve = global supply, by mine, ranked by the cost of production from each asset
This is what the cost curve looks like for lithium. (source: Benchmark).
For a project that is yet to be built, the “lurking dragon” that drives a lot of careful engineering, is to try and improve where the project will sit on the cost curve.
When a mine owner makes wise processing decisions, or invests in good engineering talent, this tends to push their project to the left-hand side of the curve. That’s where the real value is created...
As an astute reader, you may reflect that each lithium deposit must be fundamentally different. And that these differences (see 11 attributes above), must be the most important thing to influence the position of a project on the cost curve.
How then is a project’s expected cost of production calculated? And thus its position on the cost curve known.
Understand the mine engineering process (PEA -> PFS -> FS)
Developing a mine is expensive and risky. But because humans have been mining for thousands of years, we have slowly developed an engineering process which, if properly followed, significantly reduces risk and preserves capital.
A simplified way to think about the mine engineering process is:
- Step 1 - PEA: What is the best version of this project?
- Step 2 - PFS: Does this version really work, and what could kill it?
- Step 3 - FS: Are we sure we can build this mine exactly as chosen?
Here is a handy table of the expected engineering maturity at each stage:

The above table shows some of the engineering detail that's needed.
As each lithium project is developed, its engineering packs are produced in increasing detail. This helps to define the expected cost of production with higher degrees of accuracy. Which predicts the position of the project on the cost curve.
This in turn, is what allows the value of a project to be calculated. Resulting in an enticingly large dollar figure. This valuation is often represented by project owners, to potential investors, as a Net Present Value (“NPV”).
If only these valuations were always accurate.
If only mistakes never happened, and vested interests were not real.
What can go wrong with a lithium brine project?
A lot.
A lot goes wrong.
Let’s elaborate on what causes the most common mistakes in lithium brine projects.
The Preliminary Economic Assessment (PEA) is not just about proving that a project should be built. Squint your eyes hard enough, and almost anything can be built.
The PEA’s real purpose is to identify the ideal design for the deposit - the right brine production scale, wellfield layout, and processing pathway that maximises value.
Every lithium deposit is of course different. And these differences mean that each mine plan needs to be different too.

The above image emphasizes the interconnectedness of a lithium brine project (an actual project is more complicated than what is shown).
Because of the complexity and interconnectedness of each brine project, flowsheet optimization is critical. This is the act of matching the specific brine project - its impurities, temperature, reinjection, infrastructure - with the right plant design and final product.
If the early stages of engineering are rushed past, and the ideal mine plan is misunderstood, then capital will inevitably be destroyed.
Because from the point of view of the project owner, as time and development costs stack-up, it becomes "too late to turn back".
Resisting temptation: A key temptation for project owners to resist, is rushing to the FS stage too quickly. Instead, owners should deploy the most experienced engineers early. First to understand the subsurface. Then to iterate the flowsheet intensely at the PEA and PFS stages. Before overcommitment happens.
Why owners can’t turn back: There is significant “engineering lift” that is needed between the PFS and FS stages (see table above). Not to mention the shareholder money that gets spent; the commercial agreements that get signed; the flowsheet decisions that are difficult to unwind... Human nature is a factor too. Mistakes after all, are hard to admit.
One more blind spot: is fitting the project to the team. This happens when a project is designed to fit the team’s experience, rather than the deposit’s uniqueness. For example:
- Teams that are strong in process engineering, may feel the need to design & build the plant too early.
- Capital constrained owners may rush to the feasibility stage in order to raise capital.
- The large-scale operators often have a preference for the capital intensive projects.
- And the finance-led executive teams, they push for the first mine phase to be too large.
Suffice here to say, that the NPV of a lithium brine project, is often not what it’s cracked-up to be.
How to develop lithium brine projects
The development of lithium brine projects is a new and growing sector.
This means that relative to mining in general, there are less lithium brine developers relative to the amount of lithium brine projects. Brine projects are also complicated relative to hard-rock mining.
The end result is more mistakes.
In this article we have tried to explain the lithium brine market in general; how brine projects are compared; how projects are engineered & valued; and what fundamentally causes lithium brine development mistakes.
To find a specialist in lithium brine development, simply contact us here.
Recent Posts
What is a Lithium Brine Asset Worth?
Using Digital Twin Technology in the Lithium Brine Industry
How the Inflation Reduction Act and US Trade Policy Could Handicap Its Ability to Harness Argentine Lithium Supply
The Lithium Brine Industry Must Share Reinjection Best Practices
Visions of Union County: What Groundwater Management Means for DLE & Lithium Brine Mining in the US
